Using Google Maps in Land Research

Sub-areas within the Haynes place
If we’re going to talk about land, we’re going to need maps. I chose to use the internet-based Google Maps, which are not only free but are outstanding (“amazing” may be a better word for it!) The Google Maps used here show the land within the Musquiz Grant as well as some surrounding land in Jackson, Calhoun, and Victoria counties. But we immediately run into a slight problem here, because we use two different types of Google Maps in this web site. In both cases, the Google Maps facilities at google.com/maps were used to construct the basic map.
In the first and more common case, we just leave the map as it is at Google and provide a link from this web site to the Google site. This site stores only the link to the map at Google. When that link is followed, the Internet browser dynamically displays the map using data supplied by Google, and also allows the user to interact with the map. Each map is viewable in a variety of ways, and in any of the Google Maps modes (Map, Satellite, or Earth). The Map mode shows the map essentially as a modern highway map. The Satellite mode shows the map overlaid with satellite or aerial photographs, and Earth mode provides a 3-D version of Satellite mode. Map and Satellite modes are most useful for land ownership research. Satellite mode was used for most of the research done here because it shows land features and land usage features that help in identifying property lines, but Map mode is more useful in some cases because it includes roads and road names and also makes some land features more obvious, such as rivers and lakes. Map mode may also be used to produce very satisfactory black and white maps for use in a printed document.
In the other case, such as with the map shown above, the Google map was displayed in a browser as this site was being developed. Then the screen image was captured, edited (typically at fotoflexer.com), and uploaded to this web site as a static image (.jpg file) that can be rapidly displayed, but that allows no interaction via Google Maps. This approach provides three major advantages: (1) the map can be displayed much more rapidly; (2) the map can be displayed with surrounding text added by this web site; and (3) the map can contain labels that identify various land areas.
For example, let's look at the map of the land in the Musquiz Grant in each of the two ways described above. First, follow this link to view the Google Maps version, which will be built dynamically in a new browser tab or window. Interact with the map by "dragging" it around with your mouse; zooming in or out; switching between Map, Satellite, and Earth modes; etc. Try "clicking" on any of the colored areas on the map and see what happens. Also notice the textual material on the left that provides a brief explanation of the map. You can also click on the numerous links provided there to have additional information displayed. After you've checked it out, close that browser tab or window to return here.
A Google Map Embedded Directly into this Web Site
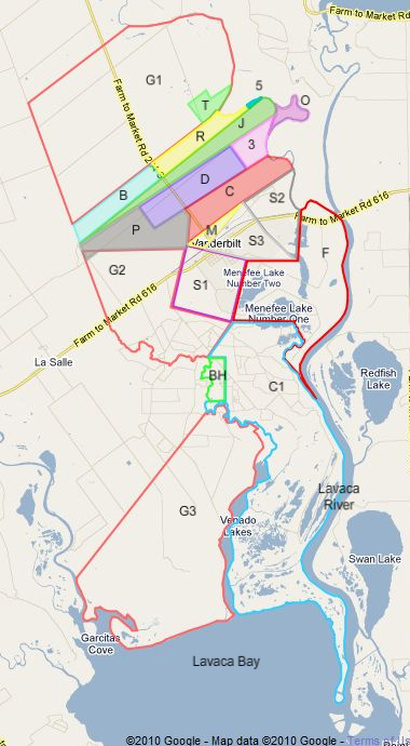
The Musquiz Grant land divided into areas of interest
Now, check out what is essentially the same map that has been inserted directly into this web site. That map is shown here on the left. Notice that this version of the map contains labels that would have been much more difficult to include on the dynamic Google map. Getting to see it doesn't require you to follow a link to some other web site, but at the same time you lose all of the interactive features of Google Maps. (All of those cryptic labels on the map are explained elsewhere.)
You should now have a feel for the differences between these two approaches. In both cases, the map is provided through the courtesy of Google, Inc. We certainly appreciate their generosity. We also thank the other companies and organizations that work with Google by providing data to be displayed on the maps. In particular, as Texans we are extremely proud of the Texas General Land Office (GLO) and the work it has done in mapping our state via aerial and satellite photography.
I wrote the initial versions of the text used to build this web site with the intent that it was to be used only in a printed document, rather than as part of a web site. Naturally, I have had to rewrite certain sections so they would be meaningful to someone using a web browser. Consequently, you may sometimes have the feeling that you are reading a book rather than interacting with a web browser, since this web site still uses some of the fixed Google maps that were developed, because as I mention above, the fixed maps provide major advantages in some cases. Wherever appropriate, I do refer to all the wonderful things that can be done interactively with Google Maps. In particular, I try to refer to various useful Google Maps features that helped me locate a given tract of land on a map.
Using Google Maps to Locate Land Areas Described in Deeds
Zooming in for a close-up of a Google Map in the Satellite view will reveal all sorts of interesting information, and may serve as an aid in locating the boundary line between two pieces of property because of different land use on opposite sides of the property line, or because of a clearing along the property line. But care has to be taken in this regard, especially in Jackson County, because the area is criss-crossed with numerous pipelines whose clearings may be mistaken for property lines. In the areas along the Lavaca River or Venadito (or Venado) Creek, if a clearing extends across the river or creek, the clearing more likely represents a pipeline instead of a property line. (Of course, to complicate the issue, there are pipelines that are built along property lines!)
I wanted to be able to draw lines and areas within a map, such as those shown in the included maps, and measure them to determine line lengths and acreage. To do this, I augmented basic Google Maps by activating the “Area and Distance Calculator.” I won’t explain all of the nitty-gritty of using these tools here, but suffice it to say that all of the tools needed to produce a complete map can be set up in just a few minutes, and mastered in a few hours. (But putting all those maps together in a coherent fashion and describing them all took much longer!)
Unfortunately, maps produced with the “Area and Distance Calculator” tool cannot be saved and made viewable by others. To produce such maps, I had to re-draw everything, but this time using the standard Google Maps tools for “Draw Line” and “Draw Shape.” The “Draw Line” tool does display line lengths, first in feet but then in miles after 5,280 feet (usable but frustrating), whereas I needed feet or yards throughout. (Actually, I needed “varas” (defined here, as well as later on this page) since that was the common unit of distance in all the deeds, so I had to do a lot of dividing by 1.08 to convert varas to yards.) The “Draw Shape” tool does not compute areas at all. (I’ve had so much experience redrawing the areas within the Musquiz Grant that I can now do it practically without notes!)
But that was the easy part. The hard part was determining how many areas I needed, and where on the map to draw each of them. For that, Carolyn and I made repeated trips to Edna (the current county seat of Jackson County, having replaced Texana in the 1880s) as well as to Hallettsville (Lavaca County), Port Lavaca (Calhoun County), and Victoria (Victoria County). At the county clerk’s office in each county, we searched through numerous deed record books for relevant deeds, and then had them copied so we could bring them home to study. We also examined the probate documents for the wills of Thomas Haynes and Amos W. Haynes (one of his sons and my great-grandfather), as well as marriage licenses, divorce papers, and court cases. Each document yielded more facts, clues, and theories, and often led to the need for even more documents to be obtained on the next trip. In fact, even when I was working on what I thought would be the final version of this web site (several versions back!), I found that I could do a better job if I made “just one more” trip to Edna (and now I need still another), and Carolyn wants to go back to Port Lavaca for just one more tidbit of information.
Since many of the deeds had been recorded in longhand as much as 160 years ago, and the pages in the oldest deed record books were laminated in plastic to protect them, and had to be reduced in size during the copying process, many were difficult to read. While gradually learning the idiosyncrasies of the handwriting and legal terminology of the period, and sometimes having to use a magnifying glass to help decipher a word or phrase, we transcribed each relevant deed or document into a much more readable word-processing file, which was given a long, descriptive name to describe the purpose of the document and allow it to be located easily later. (Fortunately, the later deeds had been recorded by using a typewriter, which greatly simplified our job.) Our transcribed version of each of these documents in available on this web site through both the "Timeline" and "Documents" links.
Given a deed, the object then was to determine which area of land was being described, to locate that land within the Google map, and to determine how that deed and that piece of land related to all the others. (Over 90 percent of the deeds contained no map or plat.) If a deed specified numeric metes and bounds of a piece of land, those measurements had to be satisfied on the map by using the “Area and Distance Calculator.” Of course, it is practically impossible to use a mouse to draw an area on a computer display and have the represented area measure exactly some desired acreage, since just the slightest movement of the mouse can change a represented line’s length by several yards or an area by several acres. (Some of the real property lines and areas involved are over 5 miles long.) But in the end, all of the areas had to have the correct orientation and be within a reasonable margin of error, and all areas had to fit together. There were many problems in this regard, as will be explained throughout, but overall these maps are reasonably accurate representations of reality.